 I recently discovered ImageSpike after reading about it on the Free Technology for Teachers blog, and I can see endless possibilities with this tool! This would be a wonderful way to make my images more interactive. According to the website, ImageSpike allows users to "mark up" photos with "interactive hotspots." This sounds confusing at first, but it's easy to understand the concept once you see a "spiked" image. It's also very easy to create one. To spike an image, first upload a picture from your PC or supply the URL address. Next, click on areas of the picture to create "hot spots." Hot spots are dots that appear on your image. When you hover over the dot, a link appears. You can link these hot spots to videos, web pages, images, etc. Again, just supply the URL for the content you want to link to the hot spot. It's multimedia on steroids. Below is my first ever "spiked" image--a photo of Bernini's The Rape of Proserpina. This shows how I would use ImageSpike in my own classroom: to link resources to an image, keeping my information organized and visually stimulating. I could also see having students create images loaded with their own hot spots; this could take place of a standard poster board presentation, or could be used as part of a student presentation. I could also have students visit a "spiked" image (similar to the image below) and then take notes or answer questions related to the media that students are directed to. This would also work great with maps; I already have plans to create a spiked image of the journey of Odysseus to use this upcoming school year. How will you use ImageSpike? 
0 Comments
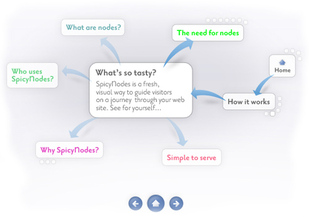 SpicyNodes is a dynamic organization tool that is designed to make content easier for your web page visitors to navigate. However, it also has plenty of educational uses; namely, it is a great tool for visually representing information in much the same way as Prezi. It offers features, including the ability to add images, music, and YouTube videos. Essentially, these "nodemaps" are multi-media mind maps. SpicyNodes is simple enough for students to create on their own. In fact, SpicyNodes offers sample lesson plans on their website HERE. SpicyNodes could also be built by teachers as an engaging way of delivering classroom notes, creating webquests, or recording group brainstorming activities. SpicyNodes could also be used for outlining information (such as book chapters), creating character profiles, or prewriting before an essay. SpicyNodes can also be used as a change of pace from standard tools, such as Power Point. 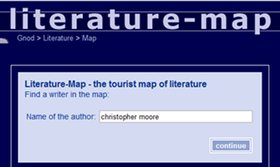 I found out about Literature Map thanks to a blog feed that I subscribe to: iLearnTechnology. Literature Map helps you choose your next novel based on the authors that you already like. Simply type in the name of your favorite author, and this website will generate a word cloud of similar authors. The originally searched author's name will appear in the middle of the word cloud and, the closer another author's name is to the center, the more likely you are to enjoy that author as well. Click on any of the new authors that pop up and a new word cloud will be generated based on the writing of that author. A great tool for students who just don't know what to read next. Click below to watch a screencast of Literature Map at work. (By the way, I completely agree with the website's recommendation to read Libba Bray if you like Stephenie Meyer. I find her Great and Terrible Beauty series to be a wonderful next read for students who have already read the Twilight series.) 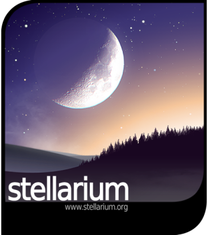 For a long time, I have always thought that it would be fun for both myself and for my students to incorporate a lesson on astronomy with my mythology unit, showing the constellations behind the myths. I thought of those night lights that project stars onto the ceiling, or the glow-in-the-dark stick-on stars that you can attach to your walls. With Stellarium, I think I have finally found what I have been looking for all along. Stellarium is a completely free download that turns your computer into the night sky. Of course, this would be especially fun if you could project the sky onto your classroom ceiling, but a white board or wall of any type would work just fine. I love the ability to add outlines or artwork of the constellations (for my purposes). If you feel like doing some actual field research out in nature, you can choose "night mode" to reduce the strain on your eyes when alternately viewing your laptop and the sky. Below I'm embedding a screencast of myself playing around with the features of Stellarium. Also, while you're at it, listen to some excellent celestial-appropriate music by Kevin McLeod. You can hear more of his royalty-free music HERE. 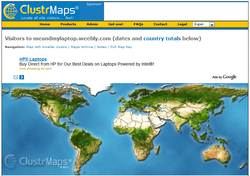 ClustrMaps is a fun and informative widget that you can embed on your website, or the websites of your students. Simply visit the ClustrMaps websites, enter the URL of the site you want to create a map for, and an HTML code will be generated for you. ClustrMaps appears as a world map with red dots, varying in size based on the amount of visitors from a particular region. Of course, since discovering ClustrMaps my blog has had an all-time low number of visitors (an extremely modest 14) but what's really interesting is that I had no idea people were visiting my website from their homes in Ireland, Australia and Singapore. The idea of someone across the globe stumbling into my humble little blog is so neat! As a student, I would be so excited to see how many people were viewing my writing portfolio, and where those readers might be located. With that said, (shameless begging) please forward the URL for my blog to as many foreign countries as possible! I want more dots! UPDATE (7-8-11): I was noticing some major inconsistencies between my clustr map and the statistics that I was receiving from Weebly (my website host). For instance, as of today, my clustr map reports 130 visitors to my website; however, according to Weebly, I had 248 visitors yesterday alone. With the question "what's up with that?" spinning in my head, I discovered that Clustrmap only counts visits to the page where the map itself is displayed, so if anyone visits another blog or post (anything other than the page where I embedded the clustr map) it won't be counted. Weebly, on the other hand, counts visits to any blog or post on my website. This makes sense, really. Not sure how to "fix" this solution so that Clustrmaps counts all of my page views without embedding the map on every since page, though. I'll play around with it and, in the meantime, you may see some clustrmaps randomly appearing. :) UPDATE 12-16-11 A HUGE thank you to the ClustrMaps team for explaining why Weebly's tallies are inconsistent with ClustrMap's stats. And another thank you to ClustrMaps for providing such accurate information without counting duplicate visitors or IP addresses. Comparing ClustrMaps' visitor count to Weebly's visitor count will provide me with a whole new layer of data! (Please the comment posted below by the ClustrMaps team.)  Google Lit Trips offers several files that work with Google Earth and serve as virtual field trips marking various settings in different works of literature. I've used the Google Lit Trip for The Odyssey and Macbeth personally, both with great results. I'm also eager to explore the student-created poetry lit trip. Lit Trips are organized by grade level (K-5, 6-8, 9-12, and Hi Ed). The trips that I have used were relatively easy to navigate, and contained photos and textual quotations to augment my lesson. This is a great option for stories in which the setting is highly important, and visualization would be helpful. |

AuthorDr. Jessica Pilgreen, Ed.D. Archives
December 2020
Categories
All

|
