 I recently discovered ImageSpike after reading about it on the Free Technology for Teachers blog, and I can see endless possibilities with this tool! This would be a wonderful way to make my images more interactive. According to the website, ImageSpike allows users to "mark up" photos with "interactive hotspots." This sounds confusing at first, but it's easy to understand the concept once you see a "spiked" image. It's also very easy to create one. To spike an image, first upload a picture from your PC or supply the URL address. Next, click on areas of the picture to create "hot spots." Hot spots are dots that appear on your image. When you hover over the dot, a link appears. You can link these hot spots to videos, web pages, images, etc. Again, just supply the URL for the content you want to link to the hot spot. It's multimedia on steroids. Below is my first ever "spiked" image--a photo of Bernini's The Rape of Proserpina. This shows how I would use ImageSpike in my own classroom: to link resources to an image, keeping my information organized and visually stimulating. I could also see having students create images loaded with their own hot spots; this could take place of a standard poster board presentation, or could be used as part of a student presentation. I could also have students visit a "spiked" image (similar to the image below) and then take notes or answer questions related to the media that students are directed to. This would also work great with maps; I already have plans to create a spiked image of the journey of Odysseus to use this upcoming school year. How will you use ImageSpike? 
0 Comments
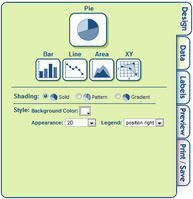 Create a Graph allows users to easily create attractive graphs and charts. As an English teacher, this would be helpful for creating visual aids for persuasive speeches. This would also be useful for science teachers, given the amount of graph and chart analysis on standardized tests. (The science portion of the ACT is almost entirely composed of charts.) There are plenty of customizable options to play with, and the final product can be saved, printed, or e-mailed. Create a Graph offers an extensive of file format options for download (pdf, svg, png, jpg, emf or eps). Below I'm embedding a few sample graphs that were created in a manner of minutes. I chose the light blue background and 3D options as a matter of personal preference; they can be altered to fit your needs. 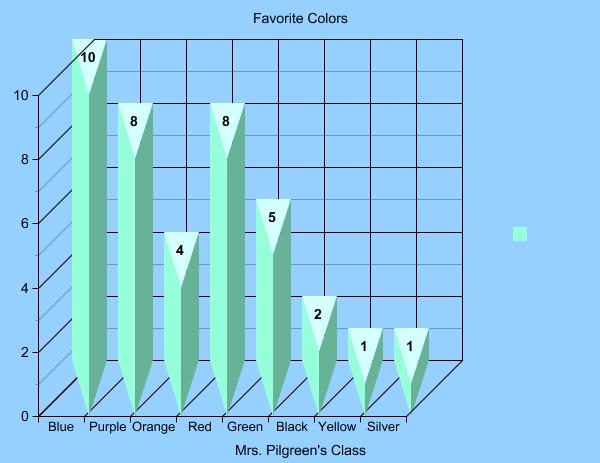  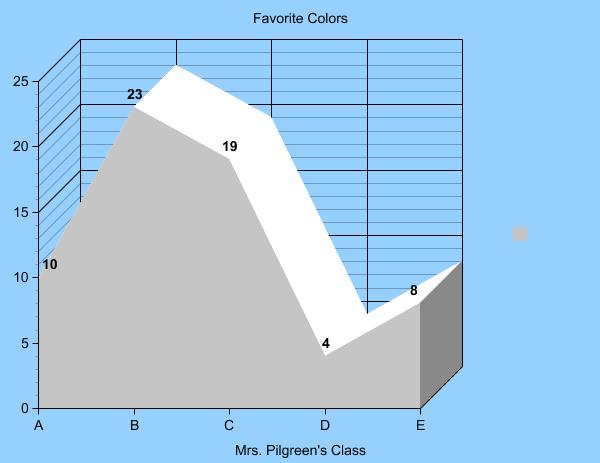 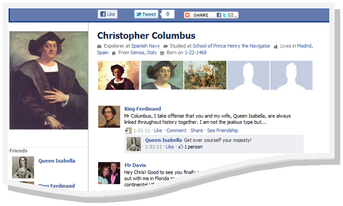 My Fake Wall allows user to create fake Facebook walls for fictional (or nonfictional) characters. The fake wall to the left is from the website's "Favorite Fake Walls." This would make an excellent exercise for introducing characterization. I would love to see a chemistry teacher have students create fake walls for different chemicals, or see a math teacher have students create walls for different geometric shapes or theorems. 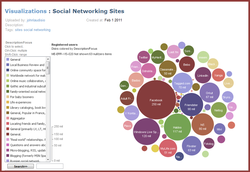 ManyEyes brings va-va-voom to data visualization. Create your own visualization, or browse charts, graphs and tables that have already been created. 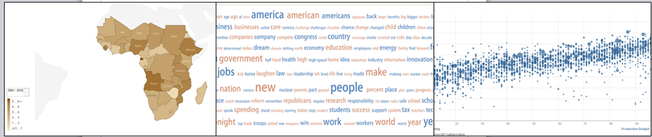 This is your new blog post. Click here and start typing, or drag in elements from the top bar.
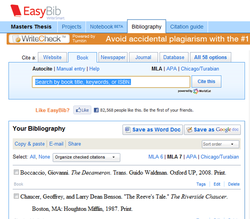 EasyBib is a great tool for creating bibliographies in MLA, APA or Chicago/Turabian style. What makes it even better than resources like Noodle Tools or Citation Machine is that, with Easy Bib, you can actually search the title of your source to see if a citation already exists. You can even search by ISBN number. Also, because this is a web application, your bibliography is saved online, so you can access it from work or home, and there is nothing to download. I'm currently using EasyBib for my Master's thesis, and I love how easy it is to use. There's even an option to add annotations to your entries for an annotated bibliography, and when all of the work is finished, EasyBib will turn your bibliography into a Word document. 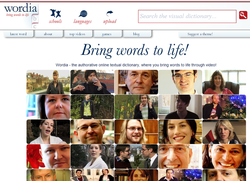 Wordia succeeds at "bringing words to life." Search just as you would with any online dictionary, or other search tool. The results are in the format of brief video descriptions of the searched word.  www.qwiki.com
Like many of the sources that I find and instantly fall in love with, I first discovered this on the Free Tech for Teachers blog, which is an excellent source in and of itself. I would describe Qwiki as Wikipedia, but designed for the multi-media-obsessed-visual-learners-with-attention-span-issues out there like me. You simply type in a search topic (I searched Romeo and Juliet because my English I unit on Shakespeare is quickly approaching. Needless to say, I was truly impressed with the quality of information provided. The multimedia, picture-rich entries are not long-winded, and easily captured my attention. One of the best features was that, if you want more information on a topic, related videos will pop up at the bottom of the entry. Also, words and phrases that have related entries appear in blue during the entry that you are watching. |

AuthorDr. Jessica Pilgreen, Ed.D. Archives
December 2020
Categories
All

|
