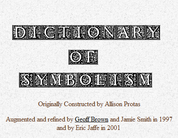
 The University of Michigan sponsors a wonderful Dictionary of Symbolism online. This is a great reference to share with students when you are reading a text that makes rich use of symbolism. It's also great for having students research symbolism for their own writing or projects. Because my senior-level British Literature class discusses symbolism is so many of its texts, I have a Shield of Symbolism project that my students creat during the first week of the semester. Students search this website for symbols that represent their physical and emotional characteristics. It's a great way to review symbolism while learning a little more about my students. You could also put together a symbolism scavenger hunt (find one item that symbolizes death, for example). You could also have your students create their own symbolism dictionary using wikispaces. Below, I'm embedding a sample screenshot of an entry located on this website.
0 Comments
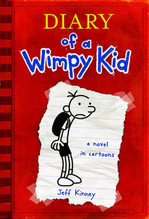 Create a fun avatar inspired by the Diary of a Wimpy Kid book series on the Wimp Yourself website. This would be a fun activity to go along with reading the book, for create an illustration to accompany a Diary of a Wimpy Kid-inspired journal entry, or to create an avatar for student blogs. Below is a screenshot of my own Wimp Yourself creation. Because the page is animated (your avatar will move around a little bit), I had to use Ctrl+Print Screen in order to capture the image of my cartoon character. 
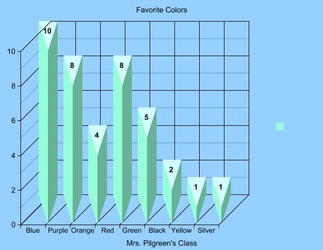
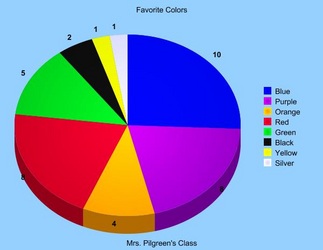
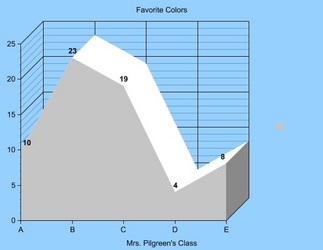
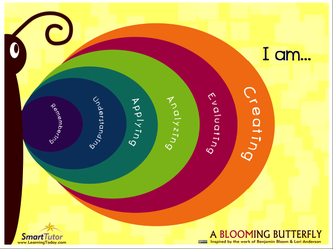
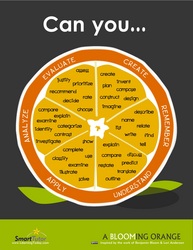
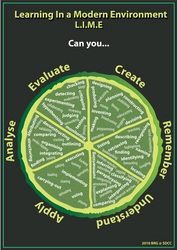
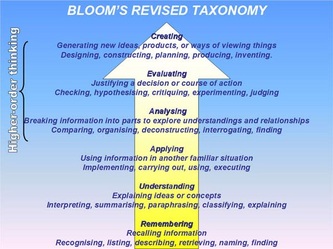
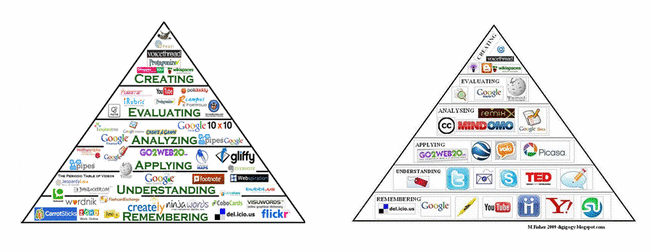
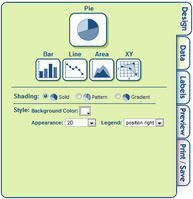 Create a Graph allows users to easily create attractive graphs and charts. As an English teacher, this would be helpful for creating visual aids for persuasive speeches. This would also be useful for science teachers, given the amount of graph and chart analysis on standardized tests. (The science portion of the ACT is almost entirely composed of charts.) There are plenty of customizable options to play with, and the final product can be saved, printed, or e-mailed. Create a Graph offers an extensive of file format options for download (pdf, svg, png, jpg, emf or eps). Below I'm embedding a few sample graphs that were created in a manner of minutes. I chose the light blue background and 3D options as a matter of personal preference; they can be altered to fit your needs.  Recently, I watched an amazing TED Talk by Kathryn Schulz called "On Being Wrong." I found this video to be so enlightening, both as a teacher and as a student. Among my students, I notice a sometimes disturbing need to always be right. You know the archetype: the student who brings their assignment up after they complete each individual question because they want you to check it before they turn it in for a grade. I'm always sad to see so many young people already obsessed with being right, with getting a "perfect" grade. I want my students to know that they are more than their GPA. In a recent conference on Design Thinking, the presenters from Lime Design talked about the necessity of celebrating failure because risk is a necessary part of learning. (I think they're really on to something there.) But then, while watching Ms. Schulz's TED talk, something strange happened. I shifted my concern away from my students' desire to be right, and started thinking about my own. I'm definitely not completely free of worries about succeeding, especially when it comes to my curriculum decisions in my classroom. Of course, some concern about my teaching practices is healthy; it keeps me from resting on my laurels or becoming complacent. Ms. Schulz has, however, made me more aware that this concern can, at times, become stifling, and that I should never keep an overwhelming fear of failure from taking a chance that could end in success.  PodBean offers free audio and video podcast hosting, so that when you are finished making your amazing podcasts, you have somewhere to put them. PodBean will also generate code for you so that you can embed one of those handy-dandy bars on your website. PodBean also gives you access to tons of free educational (and entertaining) podcasts. Some that might interest educators include: TED Talks, NOVA, Grammar Girl, CNN Student News, and Kidspeak. (Kidspeak podcasts feature student-created tutorials for other students on topics such as Microsoft Word tips and long division). Podcasts can be streamed from your computer or downloaded for later viewing. You can also subscribe to different "shows" to get updates when new podcasts are uploaded. Note: Below, I am embedding a sample podcast. It's an audio recording of one of my students reciting an original poem. I plan on making more of these recording to post on our literary club's website. This will give you an idea of what PodBean podcasts will look like on your own website or  For a long time, I have always thought that it would be fun for both myself and for my students to incorporate a lesson on astronomy with my mythology unit, showing the constellations behind the myths. I thought of those night lights that project stars onto the ceiling, or the glow-in-the-dark stick-on stars that you can attach to your walls. With Stellarium, I think I have finally found what I have been looking for all along. Stellarium is a completely free download that turns your computer into the night sky. Of course, this would be especially fun if you could project the sky onto your classroom ceiling, but a white board or wall of any type would work just fine. I love the ability to add outlines or artwork of the constellations (for my purposes). If you feel like doing some actual field research out in nature, you can choose "night mode" to reduce the strain on your eyes when alternately viewing your laptop and the sky. Below I'm embedding a screencast of myself playing around with the features of Stellarium. Also, while you're at it, listen to some excellent celestial-appropriate music by Kevin McLeod. You can hear more of his royalty-free music HERE.  When you open Tone Matrix, it looks similar to the beginning of a game of Minesweeper, a field of shaded boxes. However, as you click or drag across the squares, they light up and create different synthesizer tones. You end up with your own light, random (or carefully calculated, depending on your approach) music. Don't underestimate this game's addictiveness. This is great for music lessons, but also for looking at mathematical patterns. Watch it in action below. 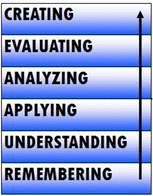 After reading a recent guest post by Kevin Creutz on Free Tech 4 Teachers, I started looking for more resources about Bloom's Taxonomy (specifically, Bloom's Revised Taxonomy) and technology. Often, I know that technology gets a bad rap as being "fluff" that doesn't challenge students. This might be the case if your use of technology is taking students to the computer lab so they can play games on One More Level (although nearly any type of gaming is going to require problem-solving and logic skills). However, many Web 2.0 tool allow students to create products; they have the opportunity to be creative and productive in authentic ways that I never had as a student. And "creating," whether you are using technology or not, sits proudly at the top of Bloom's Taxonomy. Of course, by using technology to create, your students might just feel that the assignment is a little more relevant AND fun; in fact, they might be tricked into not realizing just how complex the task they are performing actually is. One thing that I learned about Bloom's Revised Technology is that it comes in a variety of shapes, sizes, and posters. I applaud the creativity of the butterfly, lime, and orange; they are really eye-catching and would probably be a hit with visual learners. For my own students, I plan on using the flow chart on the far right next year. I think it is does the best job of not only illustrating the levels of Bloom's Taxonomy, but also explaining what each verb means, which is where my students have struggled in the past. "Mrs. Pilgreen, does using the word in a sentence count as creating? You're creating a sentence." Poster Sources: Lime Poster: http://jamiebowring.typepad.com/blog/2010/03/the-lime-taxonomy.html Butterfly & Orange Posters: http://jamiebowring.typepad.com/blog/2010/03/the-lime-taxonomy.html Flowchart: http://www.slideshare.net/mrjportman/blooms-taxonomy-short-version I also really like the pyramids below because they give examples of specific Web 2.0 tools that can be used at various levels of Bloom's Taxonomy. Of course, being a fan of Wikispaces myself, I was pleased to see Wiki-ing as one of the highest-level activities on both pyramids. A Call for Help...
I would love to hear from you about the Web 2.0 tools that you are currently using (or would like to use) and where those tools fall in the Bloom's Taxonomy. This summer, I plan on making a visual aid similar to the two pyramids above with additional Web 2.0 tools listed. Of course, when it is finished, I will be sharing it here on my blog. I've been using my IPEVO p2v camera for about a week now, and I love it! For the price, you really can't ask for more. I created the screencast below to demonstrate some of the uses for it. For more ideas on how to use this, or any other document camera, visit Tom Barrett's Interesting Ways To Use a Visualizer. My students were dazzled with the ability to project live images from the camera to the Smart Board, and many of them wanted to test it out by projecting each other on the big screen (go figure). I'm excited about how much time and paper this little gizmo will save me; hopefully, it will reduce the amount of frantic races to the copy room when I realize that I forgot to run off one hundred and twenty copies of vocabulary worksheets or bellringer activities. I'm excited about finding more ways to put this camera to use. Please feel free to comment on your own experiences with document cameras. Note: View my previous post on the IPEVO p2v camera HERE. On Another Note: The embedded video was shot in a low light setting, similar to the lighting in my classroom when most of the lights are turned off. |
AuthorDr. Jessica Pilgreen, Ed.D. Archives
December 2020
Categories
All
|

